Tamil YouTube Video Views: The First 72 Hours (2026 Study)
Scriptio Research · Published 1 August 2026 · Data collected 19 July to 1 August 2026 · Version 1.0
Corrections and questions: contact@scriptio.in. This page is updated in place, and any change is noted here.
Quick Summary
Key findings
Day one: The median Tamil YouTube video reached 1,847 views in its first 24 hours, measured across 1,594 videos from 120 channels captured between 19 July and 1 August 2026.
Spread: A quarter of Tamil YouTube videos sat below 602 views on day one and a quarter above 8,381, in a sample of 1,594 videos published between 19 July and 1 August 2026.
Growth: Tamil YouTube videos gained a typical 47 percent from day one to day two and 14 percent from day two to day three, so most of a video's early growth is finished within 72 hours (Scriptio, 2026, n=1,594).
Trending videos: Tamil YouTube videos that reached the platform's most-popular feed ran 93 to 151 times above the ordinary median, which is why the 307 such videos are reported separately from the 1,594-video panel (Scriptio, 2026).
Almost nothing loses views: Of 1,485 Tamil YouTube videos tracked across their first two days in July 2026, 1,478 gained views and exactly one lost views.
Niche figures: Niche-level view counts on Tamil YouTube differ enormously but were not stable at this sample size: removing 13 percent of the 1,594-video sample moved overall medians by under 1.5 percent while moving individual niche medians by up to 119 percent (Scriptio, 2026).
What the sample is: The study covers 1,594 videos from 120 Tamil YouTube channels over 14 days in July 2026, one snapshot per video per day; it is a curated sample of channels above roughly 10,000 subscribers, not a random draw, and excludes Scriptio's own users.
How Many Views Does a Tamil YouTube Video Get in 24 Hours?
In this sample of 1,594 Tamil YouTube videos, the median video reached 1,847 views in its first 24 hours.
That number is lower than most Tamil creators expect. We could not find a published benchmark for Tamil YouTube anywhere, so we measured one.
You upload at night. You check the next morning. You see 400 views and you decide the video failed. Then you go looking for what went wrong, and every answer you find is built on American channels in English.
You did not fail. You measured yourself against the wrong market.
Tamil is not a small market either. IAMAI and Kantar's Internet in India 2024 report found that 98 percent of India's internet users access content in Indic languages, with Tamil among the most widely used, and that 57 percent of urban internet users prefer regional-language content. There are simply no published benchmarks for it.
Scriptio tracked 1,594 Tamil YouTube videos from 120 channels across 14 days in July 2026, capturing each video once per day. What follows is where the middle of that sample sits.
The day one, two and three benchmark
| Video age | Videos measured | Bottom quarter | Median | Top quarter |
|---|---|---|---|---|
| 0 to 24 hours | 1,490 | 602 | 1,847 | 8,381 |
| 24 to 48 hours | 1,589 | 1,060 | 3,488 | 17,391 |
| 48 to 72 hours | 1,147 | 1,575 | 7,313 | 31,211 |
Read the outer columns before the middle one. A quarter of these videos sit under 602 views on day one. A quarter sit above 8,381. The spread inside a single language market is enormous, and any single number hides it.
This median is unusually well tested. When we removed an eighth of the sample partway through this study, it moved by 1.4 percent. The niche section below explains why that matters.
Why Does Growth Stop After 48 Hours?
Growth does not compound on Tamil YouTube. It collapses after the second day.
The table above compares different sets of videos at each age, so it cannot tell you what happens to one video over time. For that, we tracked the same videos from one day to the next.
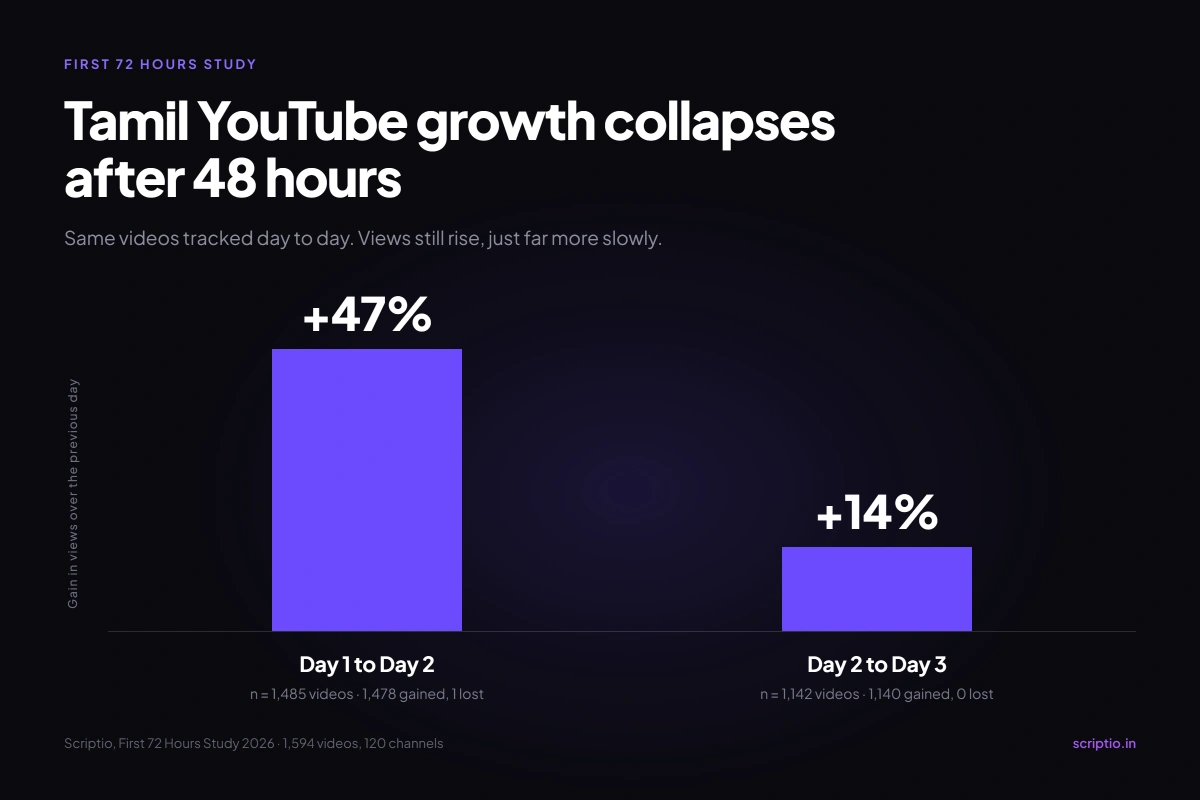
Gain in views over the previous day, same videos tracked across bands. Day one to day two, n = 1,485. Day two to day three, n = 1,142.
| Transition | Videos tracked | Typical gain | Multiplier | Gained | Lost |
|---|---|---|---|---|---|
| Day 1 to day 2 | 1,485 | +1,104 views | 1.47x | 1,478 | 1 |
| Day 2 to day 3 | 1,142 | +965 views | 1.14x | 1,140 | 0 |
A Tamil video gains about half again its views on the second day. On the third day it gains a seventh.
The direction almost never reverses. Out of 1,485 videos followed from day one to day two, one single video went down. This is the strongest finding in the study, because it compares each video against itself rather than against other videos, so it does not depend on how the sample was selected.
For a creator, that has a practical consequence. Whatever your video is going to become, it has largely decided by hour 48. Refreshing the analytics tab on day five is not going to change the number, and the hours you spend there are hours the next video does not get.
But My Video Is Still Growing on Day Five
Fair. Some do.
The 14 percent gain on day three is a median, which means half of all videos beat it. A video that catches a recommendation loop keeps climbing for weeks, and this study cannot tell you how far because it only ran for 14 days.
What the data does say is that the exception is rare enough that planning around it costs you. If your normal video has decided by hour 48, the highest-value hour of your week is the one you spend on the hook of the next video rather than the analytics of the last one.
Hooks decide the first 48 hours more than anything else you control. That is why the structure of a Tamil script matters more than its length, and why we published a Tamil script framework built around the opening 30 seconds.
What About Videos That Hit the Trending Feed?
Trending Tamil videos run 93 to 151 times above the ordinary median, so they cannot be used as a target.
We tracked 307 videos that appeared in YouTube's most popular feed. They were excluded from every figure above, and reported separately here.
| Video age | Videos | Median views | Times the ordinary median |
|---|---|---|---|
| 0 to 24 hours | 234 | 278,390 | 150.7x |
| 24 to 48 hours | 307 | 464,491 | 133.2x |
| 48 to 72 hours | 166 | 679,575 | 92.9x |
It is easy to end up with a benchmark built from videos like these by accident. Look at the ones everyone is already discussing, take an average, and the number is off by two orders of magnitude before you start. You can watch trending Tamil videos yourself on our trending Tamil YouTube page, and you should treat them as a separate species.
Do Views Differ by Niche? Yes, But Read This First
Niche figures at this sample size are not stable, and the table below should be treated as indicative rather than measured.
We know that because of something that happened during this study. An earlier version of the panel included 22 channels belonging to Scriptio users. Removing them cut the sample by 13 percent. Here is what that did.
| Level | Change from removing 13 percent of the sample |
|---|---|
| Day one median, whole panel | +1.4% |
| Day two median, whole panel | +0.8% |
| Day three median, whole panel | −0.7% |
| Cinema, day one | +119.5% |
| Health, day one | +81.9% |
| Travel, day one | +59.2% |
| Finance, day one | −32.9% |
| Comedy, day one | −24.0% |
A median over 1,594 videos survives losing an eighth of the sample. A median over 31 to 139 videos does not.
Four niches did not move at all, because no excluded channel sat in them: automobile, food, gaming and news. Those four rows are the only ones in the table that have been shown to be stable.
With that stated, here is the table.
| Niche | Channels (day 1) | Day 1 | Day 2 | Day 3 |
|---|---|---|---|---|
| Travel | 8 | 40,378 | 59,293 | not published |
| Automobile | 9 | 11,938 | 21,470 | 23,705 |
| Food | 11 | 11,529 | 17,350 | 20,437 |
| Gaming | 9 | 8,394 | 12,804 | 17,704 |
| Comedy | 8 | 7,465 | 18,262 | 19,901 |
| Cinema | 10 | 5,880 | 15,089 | 22,275 |
| Finance | 7 | 3,615 | 4,262 | 5,541 |
| Health | 5 | 1,459 | 2,319 | 2,587 |
| News | 8 | 896 | 1,457 | 1,624 |
| Education | 10 | 336 | 740 | 688 |
Twenty-nine cells are published across ten niches. Nine niches clear all three age bands. Travel clears two: its 48 to 72 hour cell holds 28 videos, under the 30-video threshold, so it is withheld rather than printed.
One row falls between day two and day three. Education goes from 740 to 688. This is a change in which videos fall into each band, not a decline in views. Within-video growth was not measured per niche, so the three columns are three separate benchmarks rather than one video's path.
Education is still the most useful row for a small creator. A Tamil education video at 336 views on day one is performing normally for its category. Compared against the sample-wide median of 1,847 it looks like a failure, and it is not.
Our breakdown of Tamil YouTube niche CPMs shows the earnings side of the same question, and the two do not line up. Some of the fastest-growing niches pay the least per thousand views.
Method and Data
Scriptio captured one snapshot per video per day for 14 days, then filtered hard before reporting anything.
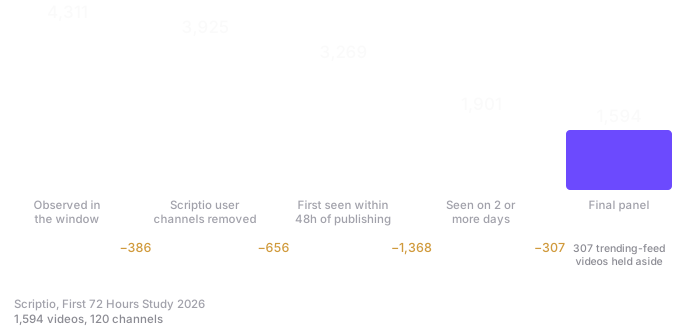
How the panel was built. Each step removes videos that could not support a like-for-like comparison.
The sample and the filtering:
- Source. Public YouTube data for Tamil channels, captured daily at roughly 09:33 IST between 19 July and 1 August 2026. View counts are as reported publicly by YouTube, which documents how engagement metrics are counted and verified.
- How the channels were chosen. The tracked set is 195 Tamil channels assembled two ways. 169 were found by per-niche YouTube search restricted to India and Tamil, filtered to roughly 10,000 subscribers and up, then graded against an internal quality bar. The other 26 are the YouTube channels of Scriptio users who completed voice analysis; all of them are excluded from this study before any other filter, removing 22 channels and 386 videos. 153 of the tracked channels published during the collection window and 120 survive into the final panel. A further 467 channels entered the raw data only through YouTube's most-popular chart for India and were removed in full. This is a curated collection set, not a random sample of Tamil YouTube.
- How niches were assigned. Three ways, depending on the channel. Search-discovered channels carry the niche they were searched under. Channels left unlabelled by that route were classified by Gemini from their existing voice profile. The third route, a creator's self-declared onboarding niche, applied only to Scriptio user channels, which this study excludes. No error rate has been measured for either remaining method, and a channel covering two subjects gets a single label.
- Starting set. 4,311 videos observed in the window.
- Filter 0. All Scriptio user channels removed, leaving 3,925 videos.
- Filter 1. First seen within 48 hours of publication, leaving 3,269.
- Filter 2. Observed on at least two separate days, leaving 1,901.
- Filter 3. All 307 trending-feed videos held aside, leaving the final panel of 1,594 videos across 120 channels.
- Unit of analysis. Each video counts once. A channel that published thirty times in the window contributes thirty videos, so the medians lean toward channels that upload frequently.
- Niche reporting rule. A niche-band cell appears only if it has at least 30 videos, at least 5 distinct channels, and no single channel supplying more than 40 percent of its videos.
Disclosure
Scriptio sells Tamil and Tanglish scriptwriting software. This study was built from data collected for product purposes, and the closing section of this page describes that product. Channels belonging to Scriptio users are excluded from the study entirely, in code, enforced by a test. The full dataset is published below so every figure can be checked independently of us.
How the quartiles are computed
Quartiles use nearest-rank with no interpolation. An earlier version of this study used a different rule that we could not recover, because only the aggregate output had been committed and never the script that produced it. Quarter-point figures may therefore differ from that earlier version by up to 0.5 percent for that reason alone, independently of any change to the sample. Medians, counts and the paired growth figures carry no such caveat and reproduce exactly.
How the reporting rule came about
The 30-video threshold was in the pipeline from the start. The 5-channel and 40-percent rules were added afterwards, once the first per-niche table had already been produced. Forty percent is a round-number judgement, not a figure derived from anything.
The rerun described above suggests the deeper problem is not where the threshold sits. Niche cells built on 31 to 139 videos moved by up to 119 percent when an eighth of the sample was removed. No threshold in that range makes them stable. That is why the niche table is presented as indicative and why no headline finding in this study rests on it.
Both CSV files below carry the full exclusion funnel in their header comments, name every omitted cell with its video count, channel count and top-channel share, and contain no channel names, channel IDs, video IDs or video titles.
- Panel CSV: the three age bands, plus the paired growth table
- By-niche CSV: the same three bands per niche
Both files are free to reuse with attribution to Scriptio, scriptio.in.
What this study cannot tell you
- It is not a random sample. The channels come from a curated collection set filtered to roughly 10,000 subscribers and up. Every figure describes those channels, not Tamil YouTube as a whole, and small channels are absent by construction.
- The niche figures are indicative, not measured. See the section above. Only automobile, food, gaming and news have been shown to be stable.
- It covers one fortnight in late July 2026. No festival, no election, no major film release. Seasonality is completely unmeasured.
- Day one counts may run low. YouTube states that metrics take time to appear in the first few hours after publishing, and that counts may be slowed, frozen, or adjusted while engagement is algorithmically verified. Our day one figure is therefore closer to a floor than a settled number. The paired growth figures compare the same videos under the same conditions and are unaffected.
- No uncertainty ranges are computed. Every figure is a point estimate with no confidence interval and no significance testing.
- Ten niches of twenty are reported. The other ten failed the reporting rule and are named in the appendix rather than estimated.
- Nothing past 72 hours is reported. Beyond three days the sample composition changes enough that a growth curve would be comparing different videos, not tracking the same ones.
- No averages are published anywhere in this study. The distributions are skewed enough that a mean would mislead. Every figure here is a median or a quartile.
- Concentration. The largest single channel contributes 3.6 percent of panel videos and the top twenty contribute 51.1 percent.
This follows the same method as our earlier Tanglish ratio study, which measured how much English sits inside Tamil YouTube speech, and which carries a correction for the same user-channel contamination found here.
Appendix: Niches Excluded and Why
Ten of the twenty niches did not meet the reporting rule. They are named here rather than dropped quietly.
| Niche | Videos (day 1) | Channels | Largest channel share | Failed on |
|---|---|---|---|---|
| Beauty | 70 | 3 | 81.4% | Channels and share |
| Tech | 63 | 4 | 58.7% | Channels and share |
| Science | 48 | 3 | 50.0% | Channels and share |
| Relationships | 43 | 2 | 86.0% | Channels and share |
| Business | 37 | 2 | 56.8% | Channels and share |
| Kids | 32 | 4 | 68.8% | Channels and share |
| Vlog | 28 | 4 | 39.3% | Videos and channels |
| Devotional | 25 | 3 | 60.0% | Videos, channels and share |
| Facts | 19 | 5 | 47.4% | Videos and share |
| Motivation | 10 | 4 | 40.0% | Videos and channels |
There are no near misses. Every excluded niche fails at least two of the three rules. Vlog is the only one that clears the concentration bar, at 39.3 percent, and it falls two videos short of the 30-video threshold.
Tech and vlog are worth naming individually, because an earlier version of this study reported both differently. Tech was listed as failing only on concentration at 41.6 percent across 9 channels; it now shows 4 channels at 58.7 percent, because most of its channels were Scriptio users. Vlog was listed at a day one median of 65,127; that figure was 19,997 once user channels were removed, and the cell no longer holds enough videos to publish at all.
How to Cite This Study
Cite this study
Scriptio (2026). Tamil YouTube Video Views: The First 72 Hours. Data collected 19 July to 1 August 2026. https://scriptio.in/reports/tamil-youtube-video-views-first-72-hours/
Figures, charts and the underlying data are free to reproduce with attribution to Scriptio under CC BY 4.0. A link back to the study is all we ask.
If you use these numbers in a story or a video, we would like to see it: contact@scriptio.in.
About the Author
Prathap is the founder of Scriptio, a Tamil and Tanglish scriptwriting tool for YouTube creators, and works in content strategy and search optimisation. He produced this study and its predecessor, the Tanglish ratio study of 119 Tamil channels.
Questions about the method, or requests for a cut of the data that is not published here, go to contact@scriptio.in.
What This Means for Your Next Upload
Your first 48 hours are the whole game, and the hook carries most of that weight.
Check your last three uploads against the day one and day two medians. If a video did not gain roughly half again by hour 48, the opening is the thing to fix. After day three the number is settled, and the effort is better spent on the next video's first 48 hours than on the last one's.
Scriptio writes Tamil and Tanglish scripts that sound like a person rather than a translation. If you already publish, it learns your voice from your own videos. If you have not started yet, it works from your niche alone, or from three short voice recordings, on the free plan, with no channel required.
Frequently asked questions
How many views is good for a Tamil YouTube video in 24 hours?
In this sample of 1,594 Tamil YouTube videos, the median video reached 1,847 views in its first 24 hours. A quarter sat below 602 and a quarter above 8,381. This is a curated sample of channels above roughly 10,000 subscribers, so treat it as a reference point rather than a platform-wide average.
Do Tamil YouTube videos keep growing after the first week?
Most slow down sharply well before that. Tracking the same videos, the typical gain is 47 percent from day one to day two, then 14 percent from day two to day three. Some videos catch a recommendation loop and keep climbing, but this study covered 14 days and cannot measure long-term growth.
Do view counts differ by Tamil YouTube niche?
Yes, by a wide margin, but the niche figures in this study are not stable. Removing 13 percent of the sample moved the overall medians by under 1.5 percent while moving individual niche medians by up to 119 percent. The niche table is published with that caveat and should be read as indicative only.
Why does this study exclude trending videos?
Videos that reach YouTube's most popular feed run 93 to 151 times above the ordinary median, so including them would distort every figure. The 307 trending videos are reported separately instead.
Does this study use data from Scriptio's own users?
No. Every channel belonging to a Scriptio user is excluded before any other filter, removing 22 channels and 386 videos. An earlier version of this study included them and has been corrected. The exclusion is applied in code and enforced by a test.
How many videos and channels does this study cover?
The final panel is 1,594 videos from 120 Tamil channels, captured once per day between 19 July and 1 August 2026. It comes from a tracked set of 195 channels, of which 153 published during the window. Full counts are published in the accompanying CSV files.
Is this a random sample of Tamil YouTube?
No. The channels come from a curated collection set built by per-niche YouTube search restricted to India and Tamil, filtered to roughly 10,000 subscribers and up. The figures describe the channels measured rather than Tamil YouTube as a whole.
How should I cite this study?
Cite it as: Scriptio (2026). Tamil YouTube Video Views: The First 72 Hours. Data collected 19 July to 1 August 2026. Available at https://scriptio.in/reports/tamil-youtube-video-views-first-72-hours/. Figures, charts and the underlying CSV data are free to reproduce with attribution to Scriptio.